Here will try to a bit deep dive in Network panel in Chrome DevTools.
Network Panel only logs network activity while it’s open.
Network Log Overview
Each row of the Network Log represents a resource or call request. By default the resources are listed chronologically. The top resource is usually the main HTML document. The bottom resource is whatever was requested last.
Let’s take a look at default columes:
- Status. The HTTP response code.
- Type. The resource type.
- Initiator. What caused a resource to be requested. Clicking a link in the Initiator column takes you to the source code that caused the request.
- Time. How long the request took.
- Waterfall. A graphical representation of the different stages of the request. Hover over a Waterfall to see a breakdown.
You can display more columes, like Protocol, domain, etc.
Some tips
-
Simulate a slower network connection By throttling the page you can get a better idea of how long a page takes to load on a mobile device. Find the Throttling menu,(it is No Throttling by default)
-
Empty Cache And Hard Reload On repeat visits, the browser usually serves some files from its cache, which speeds up the page load. Empty Cache And Hard Reload forces the browser to go the network for all resources. This is helpful when you want to see how a first-time visitor experiences a page load.
-
Capture screenshots Tick Capture Screenshots Capture Screenshots.
- You can Save requests across page loads. check the Preserve log checkbox
- Inspect a resource’s details Click a resource to learn more information about it.
- Use Headers tab to inspect HTTP headers.
- Click the Preview tab. A basic rendering of the HTML is shown.
- Click the Response tab. The HTML source code is shown.
- Click the Timing tab. A breakdown of the network activity for this resource is shown.
-
Use the Search pane when you need to search the HTTP headers and responses of all resources for a certain string or regular expression.
-
Filter resources DevTools provides numerous workflows for filtering out resources that aren’t relevant to the task at hand.
- Block requests How does a page look and behave when some of its resources aren’t available? Does it fail completely, or is it still somewhat functional? Block requests to find out:
- Shortcut
Command +Shift +P (Mac) to open the Command Menu. - Type
block, select Show Request Blocking, and pressEnter . - Click Add Pattern
- Then Reload the page.
- Shortcut
-
Replay XHR request Select the XMLHttpRequest(XHR), Right-click the request and select Replay XHR.
- Throttling
- Emulate offline. When you develop Progressive Web Apps, this is helpful.
- You can even create custom throttling profiles!
- In addition to HTTP requests, you can throttle WebSocket connections.
- Override HTTP response headers With local overrides, you can override HTTP response headers and web content, including XHR and fetch requests, to mock remote resources even if you don’t have access to them. This lets you prototype changes without waiting for the backend to support them. Local overrides also lets you keep the changes you make in DevTools across page loads. How it works:
- When you make changes in DevTools, DevTools saves a copy of the modified file to a folder you specify.
- When you reload the page, DevTools serves the local, modified file, rather than the network resource.
- Override the user agent
- Powerful Filter function on requests
- Export requests data
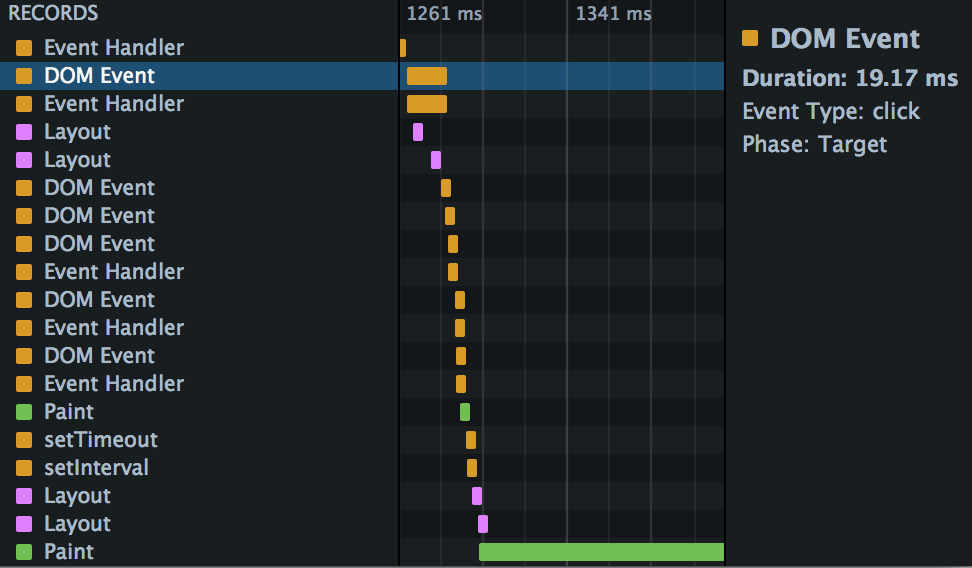
Understand Waterfall Chart
They are often used to analyze site speed and identify opportunities for optimization.
Server connections
Questions
- What is Site Speed Test
- What is routing, data fetching, and generating HTML
- What is Network Waterfall. How to read waterfall charts. Network Waterfall charts show what network requests are made when loading a web page. They are often used to analyze website speed and identify opportunities for optimization. Many DevTools provide Network Waterfall charts, Like Chrome DevTools.
It provides you with a visual representation of how all the assets on your website load. This includes CSS, JavaScript, HTML, images, plugins, and third-party content.