Lighthouse is design to help to optimize website speed. It provide two important functions:
- It creates a baseline for you to measure subsequent changes against.
- It gives you actionable tips on what changes will have the most impact.
Build Initial Report
The baseline is a record of how the site performed before you made any performance improvements. Analyze page load to create a report at the very first.
The report will
- tell scores for your selected categories.
- Metric section provides quantitative measurements of the site’s performance. Each metric provides insight into a different aspect of the performance.
- Largest Contentful Paint (LCP) measures when the largest content element in the viewport is rendered to the screen. This approximates when the main content of the page is visible to users.
- Screenshots section show collection of screenshots that show you how the page looked as it loaded.
- Opportunities section that provides specific tips on how to improve this particular page’s load performance. For example choose smaller size pictures, compress js files.
- Diagnostics section provides more information about factors that contribute to the page’s load time.
- Passed audits section shows you what the site is doing correctly.
Some tips:
- Enabling Clear Storage checkbox clears all storage associated with the page, This will audit how first-time visitors experience your site.
Actions according to Report
Enable text compression
Go to Network panel to check!
- Compare download size anf uncompression size.
- Search file Response Headers section for a
content-encodingheader.
If haven’t compression, then use commpression. For example, if you are using Node Express, then install the Node.js compression middleware via npm compression.
Resize images
Create multiple sizes of each image during the build process and then use srcset in your code. At runtime, the browser takes care of choosing what size is best for the device it’s running on.
Eliminate render-blocking resources
A render-blocking resource is an external JavaScript or CSS file that the browser must download, parse, and execute before it can show the page. The goal is to only run the core CSS and JavaScript code that is required to display the page properly.
- The
Coverage tabprovides an overview of how much of the code in js files,like main.js, bundle.js, jquery.js, and lodash.js is being executed while the page loads. TheCoverage tabcan help you analyze your code, line-by-line, and only ship the code that’s needed for page load. - The
Request Blocking tabcan show you what happens when resources aren’t available. Which can help you remove the thing we don’t need.
Do less main thread work
The main thread is where the browser does most of the work needed to display a page, such as parsing and executing HTML, CSS, and JavaScript.
- Diagnostics section in the Lighthouse report will show you the main thread activity.
- The goal is to use the
Performance panelto analyze what work the main thread is doing while the page loads, and find ways to defer or remove unnecessary work.
Improve Largest Contentful Paint (LCP)
LCP represents how quickly the main content of a web page is loaded. Specifically, LCP measures the time from when the user initiates loading the page until the largest image or text block is rendered within the viewport. To provide a good user experience, sites should strive to have an LCP of 2.5 seconds or less for at least 75% of page visits. To improve LCP, breakdown it and looking at two:
- The initial HTML document
- The LCP resource
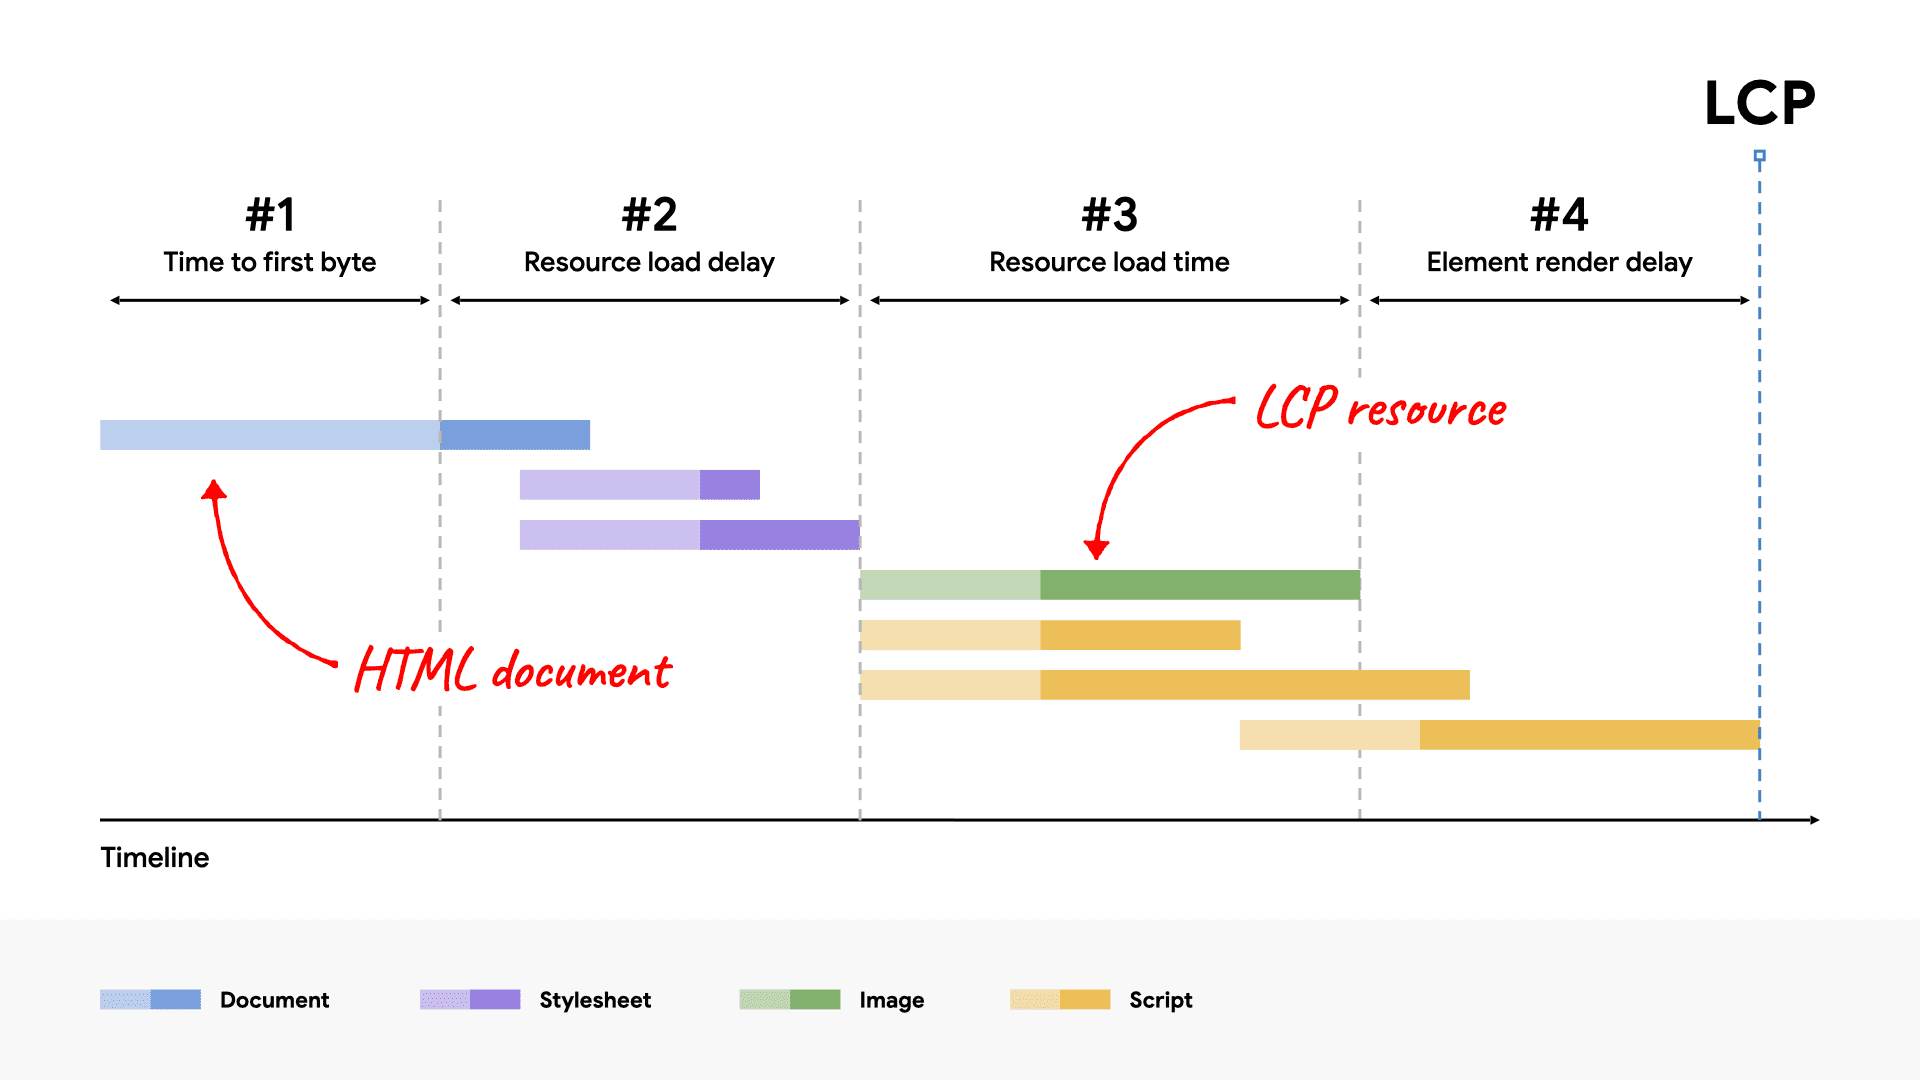
Check here for more info to Optimize LCP.
Reduce Cumulative Layout Shift (CLS)
CLS is a measure of the largest burst of layout shift scores for every unexpected layout shift that occurs during the entire lifespan of a page. Check here for more info to Optimize CLS.