NumPy
- NumPy is a Python library used for working with arrays.
- NumPy stands for Numerical Python.
- NumPy is the fundamental package for scientific computing in Python.
- It provides a multi-dimensional array object, various derived objects (such as masked arrays and matrices), and an assortment of routines for fast operations on arrays.
Why NumPy
- In Python we have lists that serve the purpose of arrays, but they are slow to process. NumPy aims to provide an array object that is up to 50x faster than traditional Python lists.
- The array object in NumPy is called ndarray, it provides a lot of supporting functions that make working with ndarray very easy.
- NumPy arrays are stored at one continuous place in memory unlike lists, so processes can access and manipulate them very efficiently.
- NumPy is a Python library and is written partially in Python, but most of the parts that require fast computation are written in C or C++.
Basic example:
import numpy as np

arr = np.array([[1, 2, 3, 4], [5, 6, 7, 8], [9, 10, 11, 12]])
subarr = arr[0:2, 1:3]

print(subarr) like this:
[[2 3]
 [6 7]]

print(np.sum(arr))  # Output: 78
print(np.mean(arr, axis=1))  # Output: [ 2.5  6.5 10.5]
Functions
np.random.normal
SciPy
- SciPy is a scientific computation library that uses NumPy underneath.
- SciPy stands for Scientific Python.
- It provides more utility functions for optimization, stats and signal processing.
- Like NumPy, SciPy is open source so we can use it freely.
- SciPy was created by NumPy’s creator Travis Olliphant.
Why Use SciPy?
- If SciPy uses NumPy underneath, why can we not just use NumPy?
- SciPy has optimized and added functions that are frequently used in NumPy and Data Science.
Pandas
Pandas is a Python library used for working with data sets. It has functions for analyzing, cleaning, exploring, and manipulating data. The name “Pandas” has a reference to both “Panel Data”, and “Python Data Analysis” and was created by Wes McKinney in 2008.
Pandas allows us to analyze big data and make conclusions based on statistical theories. Pandas can clean messy data sets, and make them readable and relevant. Relevant data is very important in data science.
Pandas makes it easy to:
- Read data from files like CSV, Excel, or databases.
- Clean and preprocess data (handle missing values, convert types).
- Perform operations like filtering, groupi- ng, sorting, and merging.
- Analyze data using built-in statistical and aggregation methods.
- Visualize data when used with libraries like Matplotlib or Seaborn.
The core components of Pandas are:
- Series: a one-dimensional labeled array.
- DataFrame: a two-dimensional labeled table, similar to a spreadsheet or SQL table.
Pandas DataFrame
DataFrame is most common class in Pandas.
import numpy as np
import pandas as pd

# Create and populate a 5x2 NumPy array.
my_data = np.array([[0, 3], [10, 7], [20, 9], [30, 14], [40, 15]])

# Create a Python list that holds the names of the two columns.
my_column_names = ['temperature', 'activity']

# Create a DataFrame.
my_dataframe = pd.DataFrame(data=my_data, columns=my_column_names)

# Print the entire DataFrame
print(my_dataframe)
You should get:
   temperature  activity
0            0         3
1           10         7
2           20         9
3           30        14
4           40        15
Common operation: You may add a new column to an existing pandas DataFrame just by assigning values to a new column name. For example, the following code creates a third column named adjusted in my_dataframe:
# Create a new column named adjusted.
my_dataframe["adjusted"] = my_dataframe["activity"] + 2

# Print the entire DataFrame
print(my_dataframe)

'''
   temperature  activity  adjusted
0            0         3         5
1           10         7         9
2           20         9        11
3           30        14        16
4           40        15        17
'''
Pandas provide multiples ways to isolate specific rows, columns, slices or cells in a DataFrame.
print("Rows #0, #1, and #2:")
print(my_dataframe.head(3), '\n')

print("Row #2:")
print(my_dataframe.iloc[[2]], '\n')

print("Rows #1, #2, and #3:")
print(my_dataframe[1:4], '\n')

print("Column 'temperature':")
print(my_dataframe['temperature'])
Pandas can read csv
pd.read_csv() Returns DataFrame or TextFileReader. A comma-separated values (csv) file is returned as two-dimensional data structure with labeled axes.
rice_dataset_raw = pd.read_csv("https://download.mlcc.google.com/mledu-datasets/Rice_Cammeo_Osmancik.csv")

# specify columns
rice_dataset = rice_dataset_raw[[
    'Area',
    'Perimeter',
    'Major_Axis_Length',
    'Minor_Axis_Length',
    'Eccentricity',
    'Convex_Area',
    'Extent',
    'Class',
]]

# print top 200 rows
rice_dataset.head(200)
pandas.DataFrame.describe Function
Generate descriptive statistics.
rice_dataset.describe()
Matplotlib
Matplotlib is a low level graph plotting library in python that serves as a visualization utility. Most of the Matplotlib utilities lies under the pyplot submodule.
What main job Matplotlib do as following:
import matplotlib.pyplot as plt
import numpy as np

xpoints = np.array([1, 4, 8])
ypoints = np.array([3, 5, 10])

plt.plot(xpoints, ypoints)
plt.show()
Then you get:
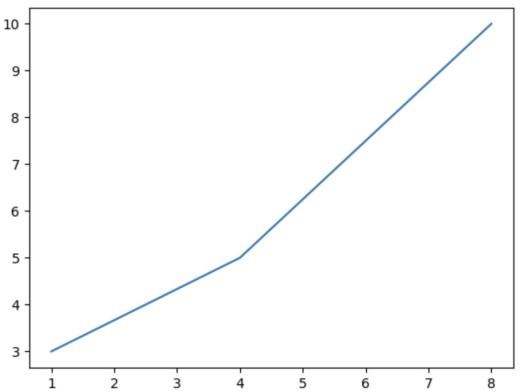
You can decorate this chart: like marker, line, label, grid, scatter, bars, histograms, pie.
openpyxl
(The first exercise) https://openpyxl.readthedocs.io/en/stable/index.html#
openpyxl is a lib which deal with Excel 2010 xlsx/xlsm/xltx/xltm files.
Create workbook
>>> from openpyxl import Workbook
>>> wb = Workbook()
>>> ws = wb.create_sheet("Mysheet") # insert at the end (default)
Load data from a file
>>> from openpyxl import load_workbook
>>> wb2 = load_workbook('test.xlsx')
>>> print(wb2.sheetnames)
Playing with cells content
>>> ws = wb.active
>>> ws['A4'] = 4
>>> d = ws.cell(row=4, column=2, value=10)
>>> for row in ws.iter_rows(min_row=1, max_col=3, max_row=2):
...    print(row) # one row is one tuple
...    for cell in row:
...        print(cell) # cell object: <Cell Sheet.A1>
save data
>>> wb.save('balances.xlsx')
Conclusion
- Lib documents supposed to support all information. Such as how to use it, Example, security.
- list, tuple, dictionary are basic object which are very good designed! and need to be familiar with.