Classification is the task of predicting which of a set of classes (categories) an example belongs to. Classification is converting a logistic regression model that predicts a probability into a binary classification model that predicts one of two classes.
There are some terms you need to be understood and remembered:
- TP, FP, TN, FN
- Threshold
- Accuracy
- Recall, or true positive rate
- False positive rate
- Precision
Threshold
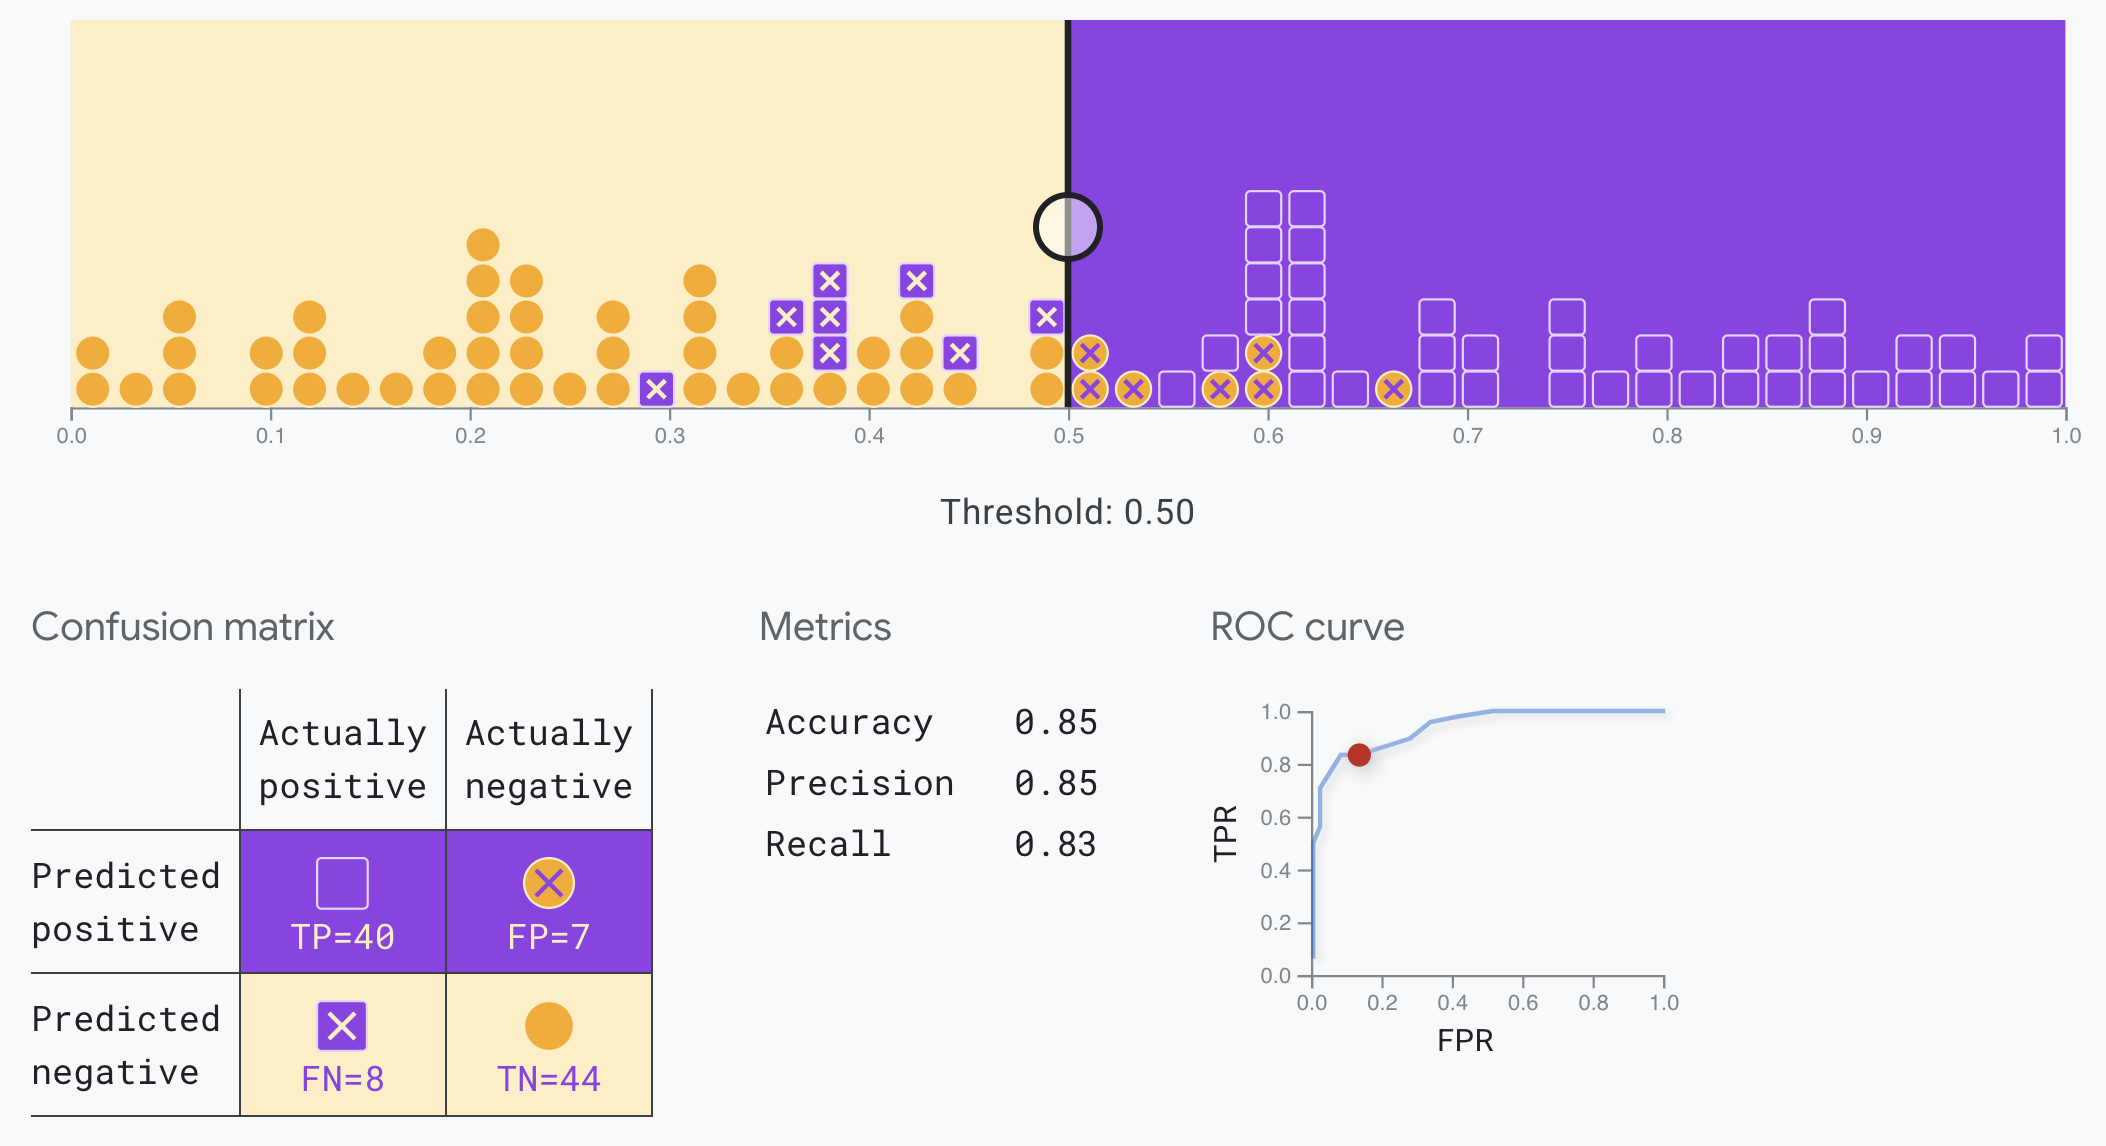
Choosing a threshold is very important for Classification. You can use tool like Confusion matrix to understand more about threshold in your model.
Confusion matrix
| Actual positive | Actual negative | |
|---|---|---|
| Predicted positive | True positive (TP): A spam email correctly classified as a spam email. These are the spam messages automatically sent to the spam folder. | False positive (FP): A not-spam email misclassified as spam. These are the legitimate emails that wind up in the spam folder. |
| Predicted negative | False negative (FN): A spam email misclassified as not-spam. These are spam emails that aren’t caught by the spam filter and make their way into the inbox. | True negative (TN): A not-spam email correctly classified as not-spam. These are the legitimate emails that are sent directly to the inbox. |
For example it can look like this:
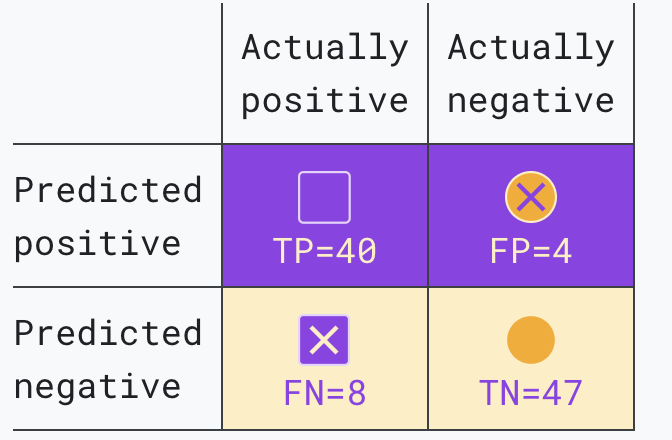
TP = it is Spam and labled as Spam FP = ir is not spam but labled as spam TN = it is not spam and labled as not spam FN = it is spam but labled as not spam
When the classification threshold increases, both true and false positives decrease. Becuase the model will likely predict fewer positives overall.
Measure Model Metrics
They are Accuracy, TPR, FPR, Precision.
TPR and FPR will be used more in Measurement.
Accuracy
Accuracy is the proportion of all classifications that were correct, whether positive or negative. It is mathematically defined as:
\[\text{Accuracy} = \frac{\text{correct classifications}}{\text{total classifications}} = \frac{TP + TN}{TP + TN + FP + FN}\]Recall, or true positive rate
The true positive rate (TPR), or the proportion of all actual positives that were classified correctly as positives, is also known as recall.
Recall is mathematically defined as:
\[\text{Recall (or TPR)} = \frac{\text{correctly classified actual positives}}{\text{all actual positives}} = \frac{TP}{TP + FN}\]A hypothetical perfect model would have zero false negatives and therefore a recall (TPR) of 1.0, which is to say, a 100% detection rate.
False positive rate
The false positive rate (FPR) is the proportion of all actual negatives that were classified incorrectly as positives, also known as the probability of false alarm. It is mathematically defined as:
\[FPR = \frac{\text{incorrectly classified actual negatives}}{\text{all actual negatives}} = \frac{FP}{FP + TN}\]A perfect model would have zero false positives and therefore a FPR of 0.0, which is to say, a 0% false alarm rate.
Precision
Precision is the proportion of all the model’s positive classifications that are actually positive. It is mathematically defined as:
\[\text{Precision} = \frac{\text{correctly classified actual positives}}{\text{everything classified as positive}} = \frac{TP}{TP + FP}\]Precision improves as false positives decrease, while recall improves when false negatives decrease.
Choice of metric and tradeoffs
| Metric | Guidance |
|---|---|
| Accuracy | Use as a rough indicator of model training progress/convergence for balanced datasets. For model performance, use only in combination with other metrics. Avoid for imbalanced datasets. Consider using another metric. |
| Recall (True positive rate) | Use when false negatives are more expensive than false positives. |
| False positive rate | Use when false positives are more expensive than false negatives. |
| Precision | Use when it’s very important for positive predictions to be accurate. |
Accoring to my understanding, Spam email model should use FPR matric, because I can’t accept labling legitimate email as spam.
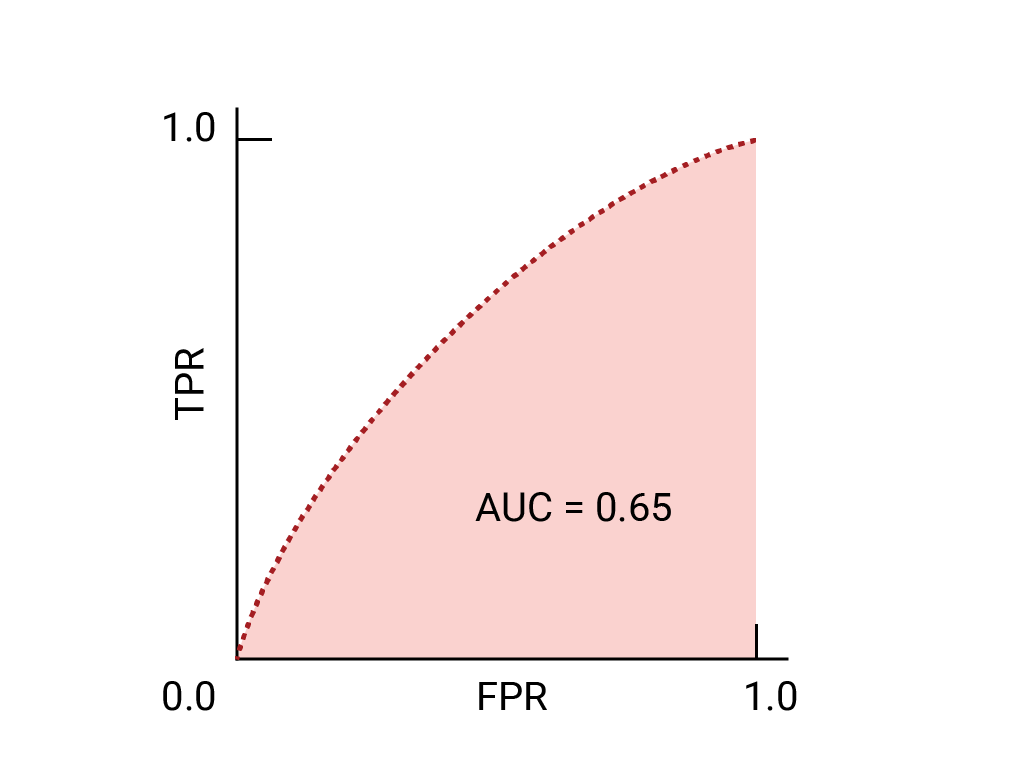
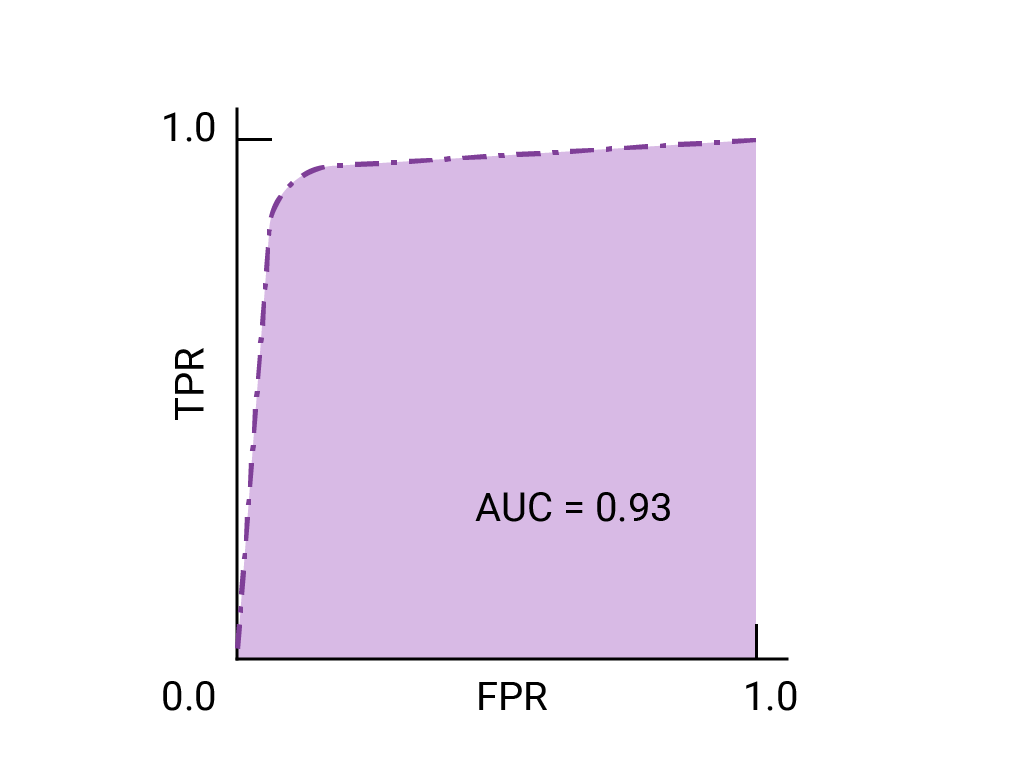
ROC and AUC
ROC
ROC curve, short for Receiver-operating characteristic curve. The long version of the name, receiver operating characteristic, is a holdover from WWII radar detection.
The ROC curve is a visual representation of model performance across all thresholds.
The ROC curve is drawn by calculating the true positive rate (TPR) and false positive rate (FPR) at every possible threshold (in practice, at selected intervals), then graphing TPR over FPR.
AUC
AUC, short for Area under the curve.
The area under the ROC curve (AUC) represents the probability that the model, if given a randomly chosen positive and negative example, will rank the positive higher than the negative.
AUC is a useful measure for comparing the performance of two different models, as long as the dataset is roughly balanced. The model with greater area under the curve is generally the better one.
Understand AUC
For a binary classifier, a model that does exactly as well as random guesses or coin flips has a ROC that is a diagonal line from (0,0) to (1,1). The AUC is 0.5, representing a 50% probability of correctly ranking a random positive and negative example.
AUC and ROC for choosing model and threshold
AUC is a useful measure for comparing the performance of two different models, as long as the dataset is roughly balanced. The model with greater area under the curve is generally the better one.
The points on a ROC curve closest to (0,1) represent a range of the best-performing thresholds for the given model.
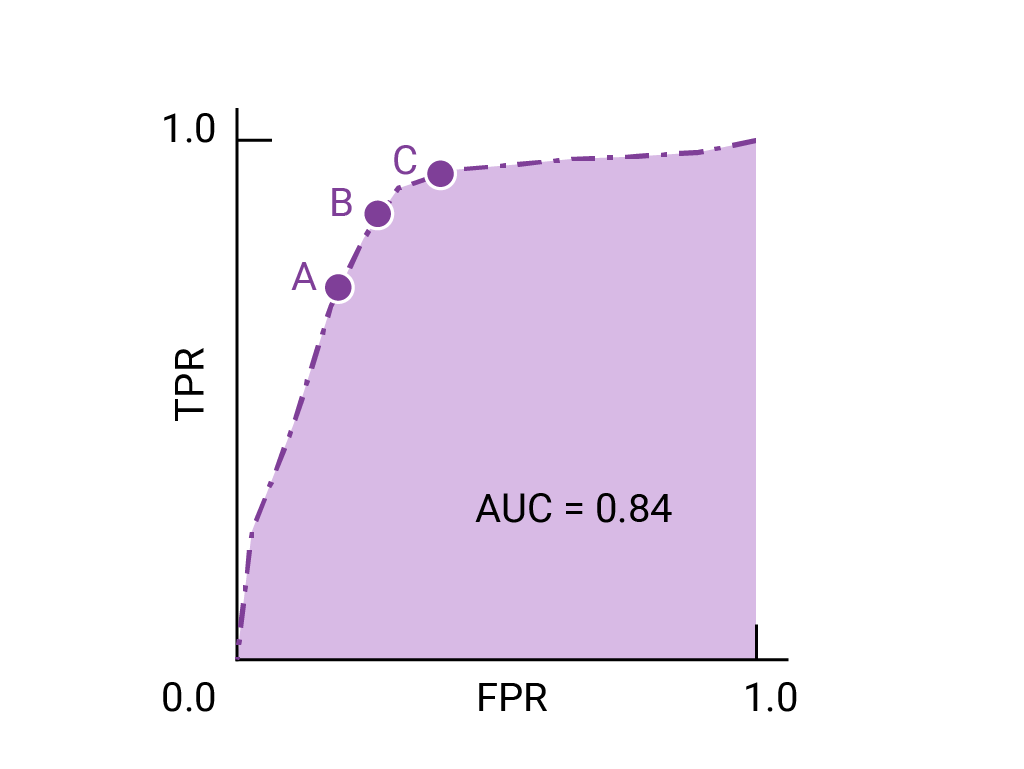
If false positives (false alarms) are highly costly, it may make sense to choose a threshold that gives a lower FPR, like the one at point A, even if TPR is reduced. Conversely, if false positives are cheap and false negatives (missed true positives) highly costly, the threshold for point C, which maximizes TPR, may be preferable. If the costs are roughly equivalent, point B may offer the best balance between TPR and FPR.
Understand AUC and ROC:
Some other concepts
Prediction bias
Prediction bias is the difference between the mean of a model’s predictions and the mean of ground-truth labels in the data. A model trained on a dataset where 5% of the emails are spam should predict, on average, that 5% of the emails it classifies are spam. In other words, the mean of the labels in the ground-truth dataset is 0.05, and the mean of the model’s predictions should also be 0.05. If this is the case, the model has zero prediction bias. Of course, the model might still have other problems.
Multi-class classification
Multi-class classification can be treated as an extension of binary classification to more than two classes.
For example, in a three-class multi-class classification problem, where you’re classifying examples with the labels A, B, and C, you could turn the problem into two separate binary classification problems. First, you might create a binary classifier that categorizes examples using the label A+B and the label C. Then, you could create a second binary classifier that reclassifies the examples that are labeled A+B using the label A and the label B.
Conclusion
Clear TP, TN, FP, FN terms.
All these terms are connected to threshold. When threshold change, they are changed. For example, when threshold increase, FN should increase.
The core Metrics are TPR and FPR.
\[\text{TPR} = \frac{TP}{\text{all actual positives}}\]Use when false negatives are more expensive than false positives.
\[FPR = \frac{FP}{\text{all actual negatives}}\]Use when false positives are more expensive than false negatives.
ROC and AUC
ROC and AUC are metrics which using TPR and FPR to train model.